matplotlib画图基础知识
matplotlib
plt.plot()绘制线性图
- 绘制单条线形图
- 绘制多条线形图
- 设置坐标系的比例
plt.figure(figsize=(a,b)) - 设置图例legend()
- 设置轴的标识
- 图例保存
-
fig = plt.figure() -
plt.plot(x,y) -
figure.savefig()
-
 import matplotlib.pyplot as plt

import numpy as np

#绘制单条线形图

x = np.array([1,2,3,4,5])

y = x + 3


plt.plot(x,y) 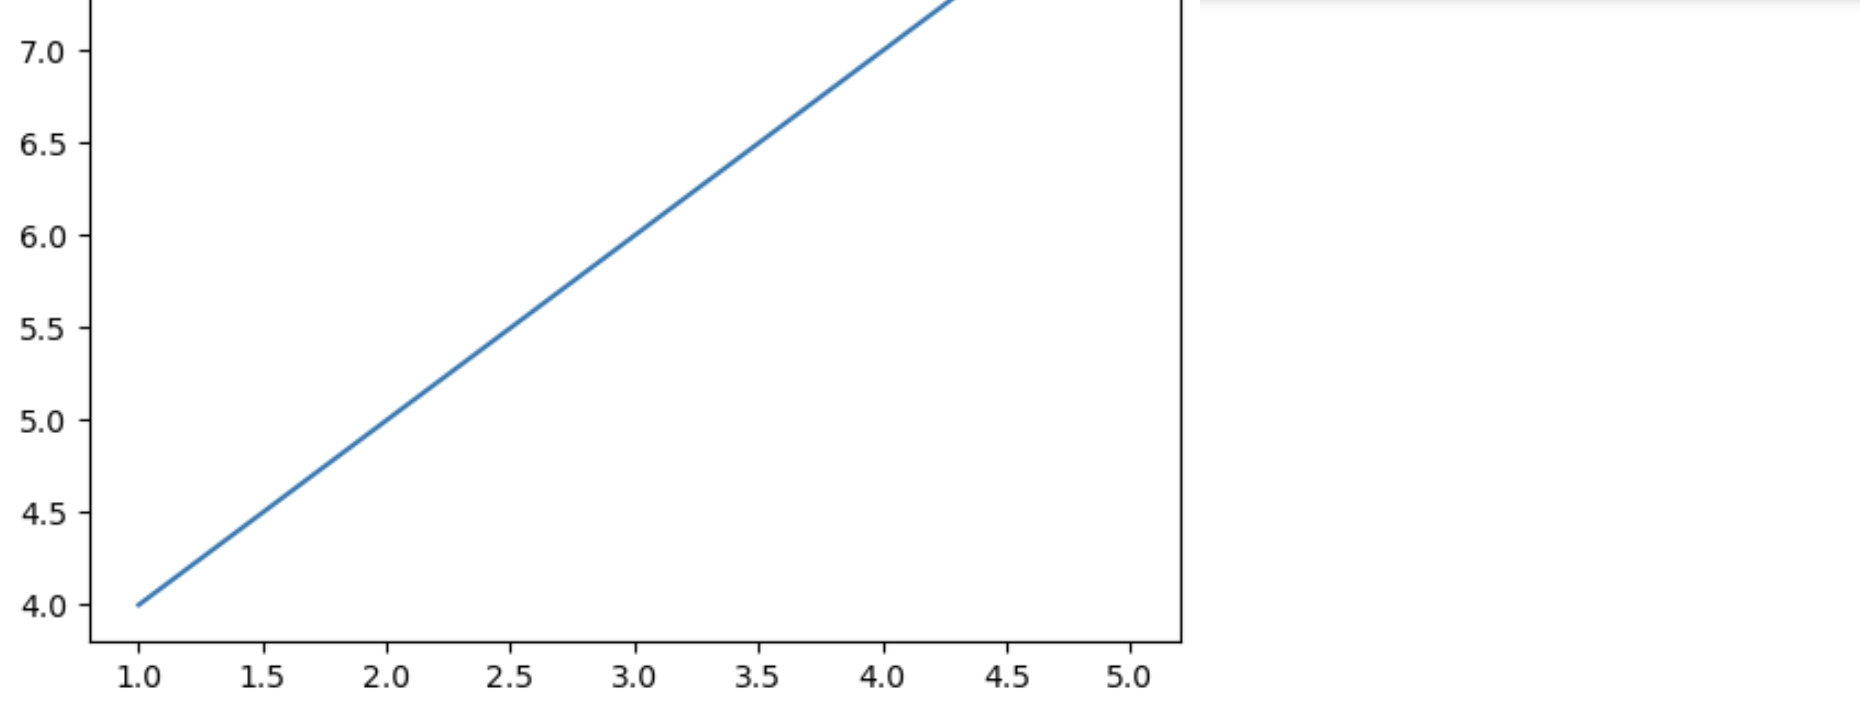
 #绘制多条线形图

plt.plot(x,y)

plt.plot(x+1,y-2) 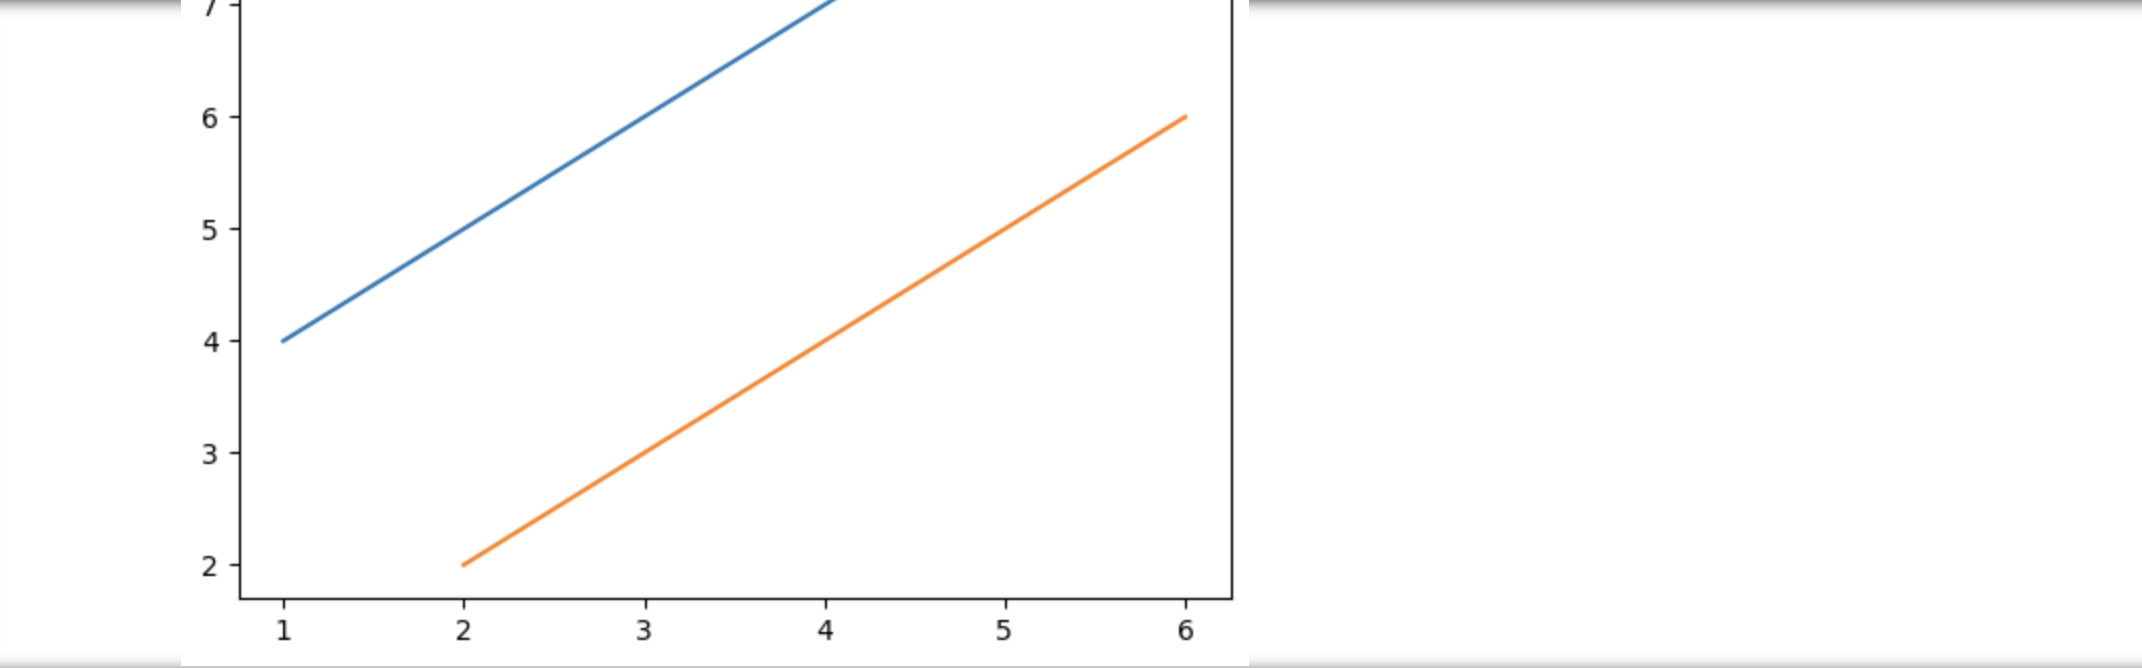
 #设置坐标系的比例plt.figure(figsize=(a,b))  图像变换,但是坐标值不变

plt.figure(figsize=(5,9))#放置在绘图的plot方法之前

plt.plot(x,y) 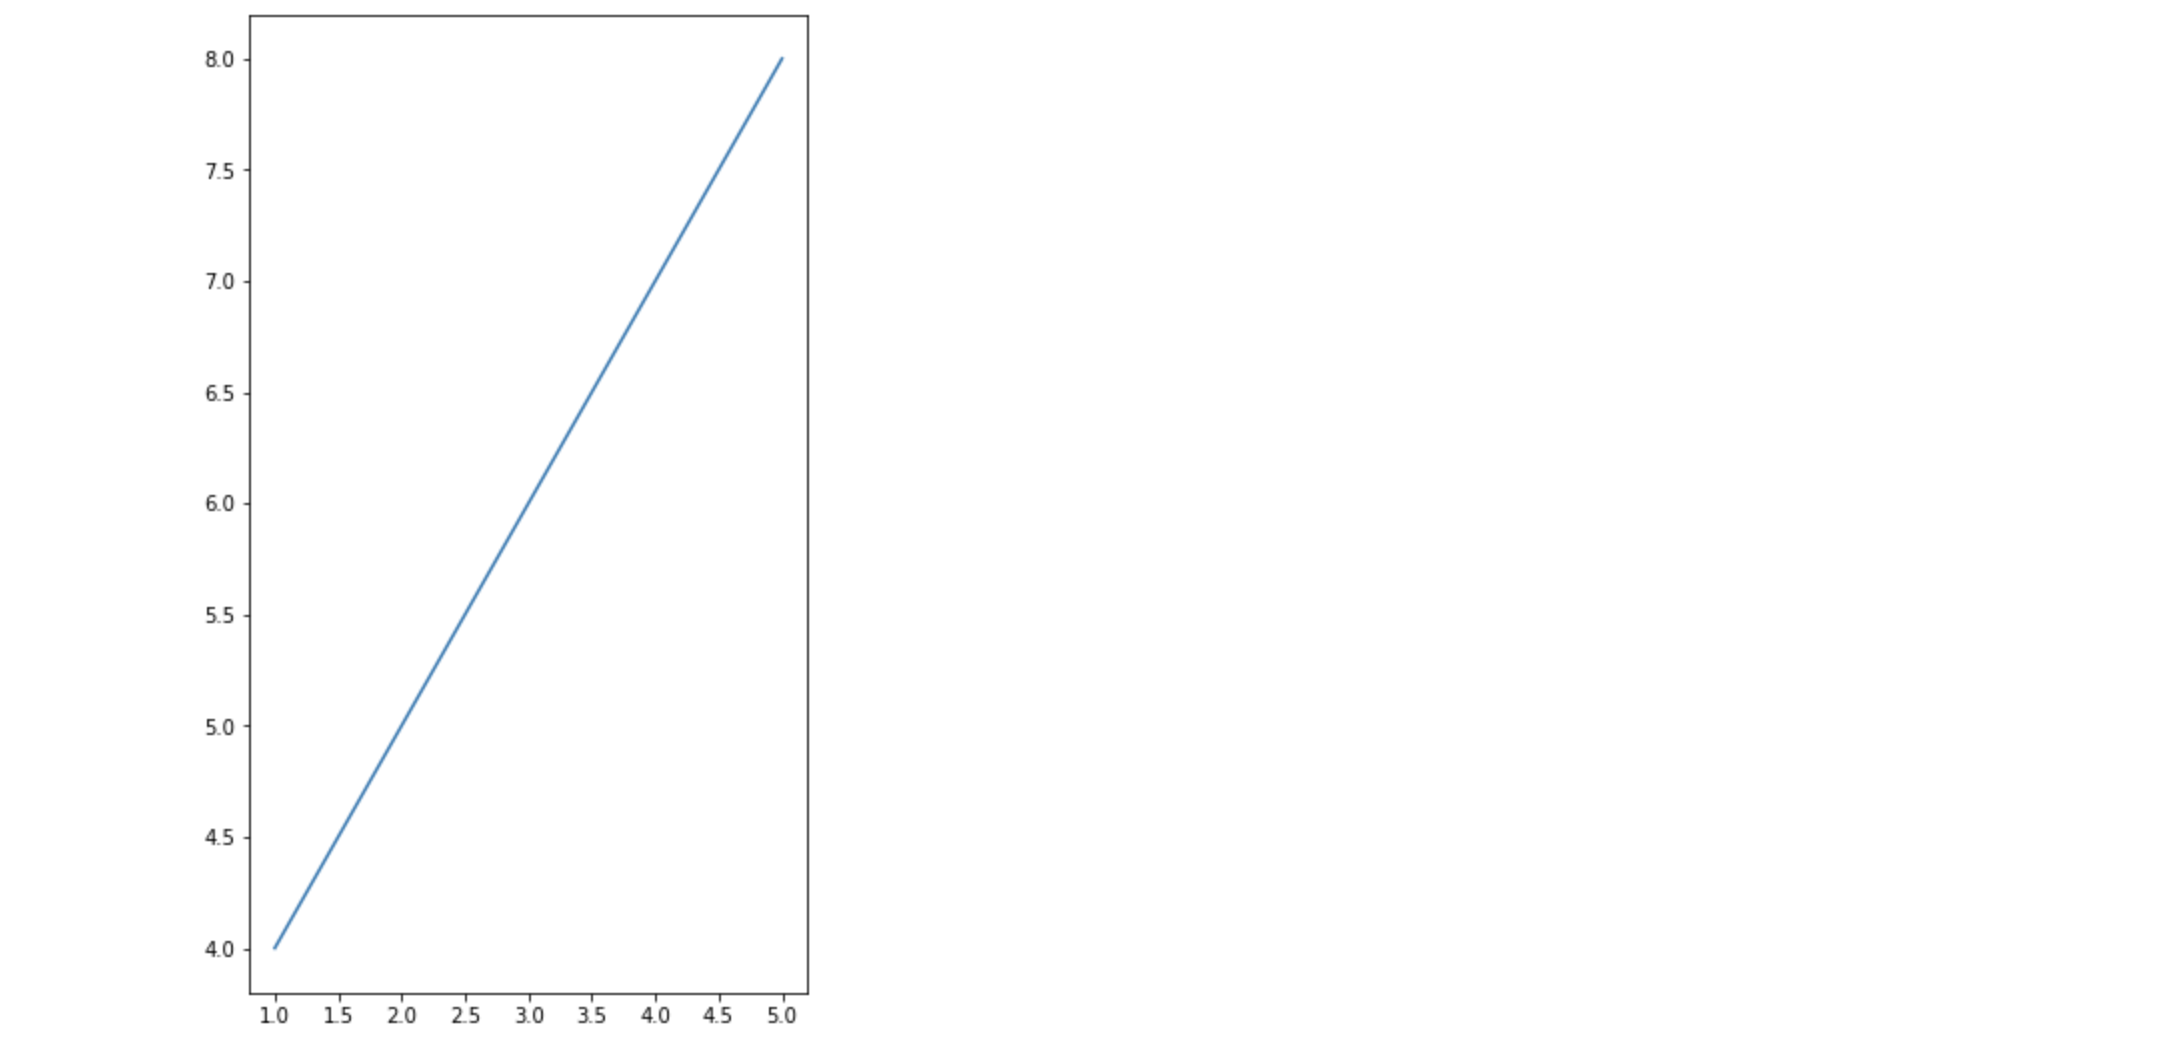
 #设置图例legend()

plt.plot(x,y,label='x,y')

plt.plot(x+1,y-2,label='x+1,y-2')

plt.legend() #图例生效 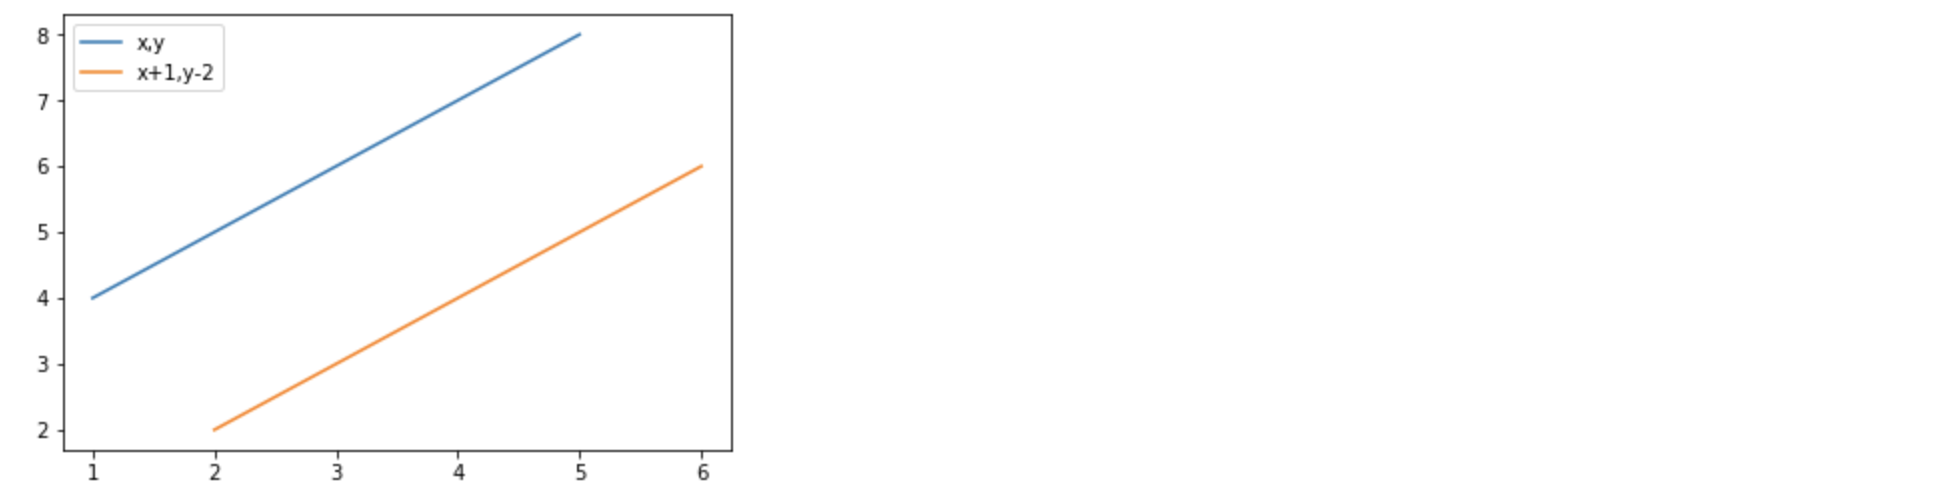

 #设置轴的标识

plt.plot(x,y)

plt.xlabel('ivanlee')

plt.ylabel('regina')

plt.title('ivanlee❤️regina') 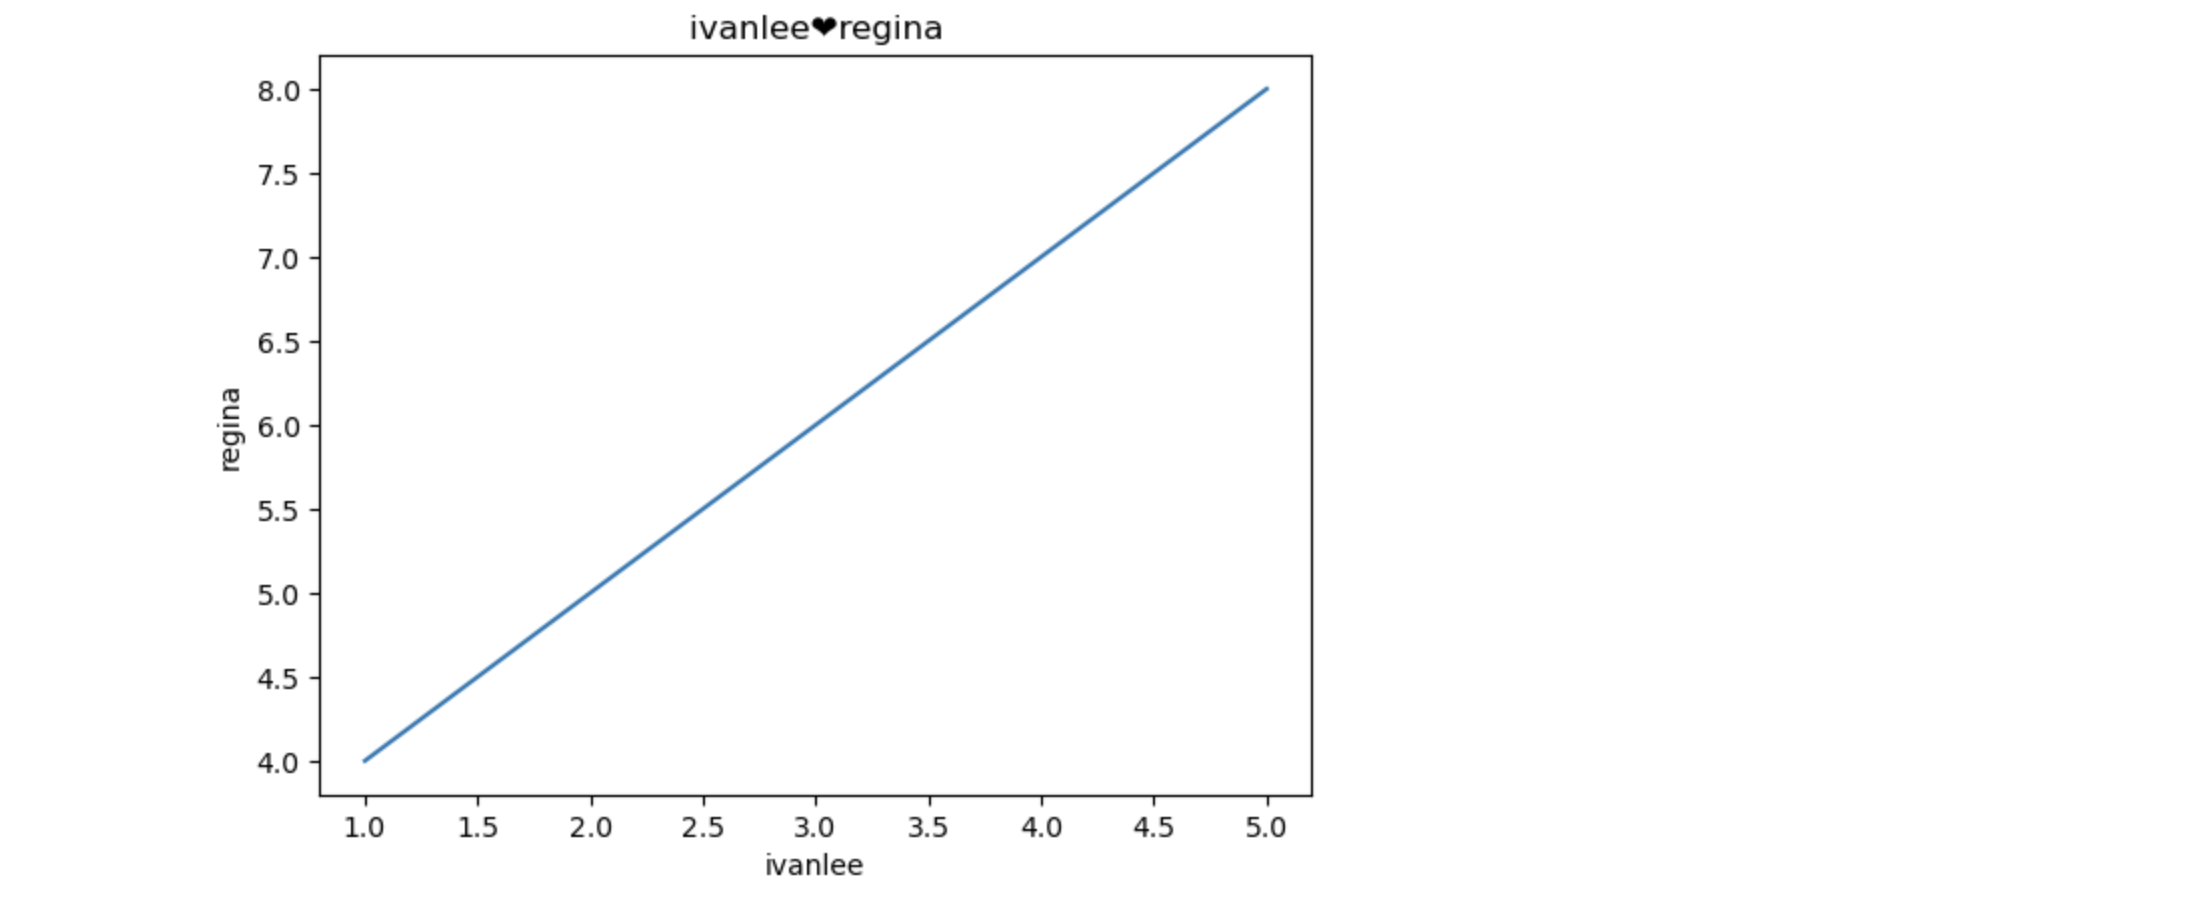
 #图例保存

fig = plt.figure()  #该对象的创建一定要放置在plot绘图之前

plt.plot(x,y,label='x,y')

fig.savefig('./123.png')
##曲线的样式和风格(自学)
plt.plot(x,y,c='red',alpha=0.5) 线条颜色和透明度 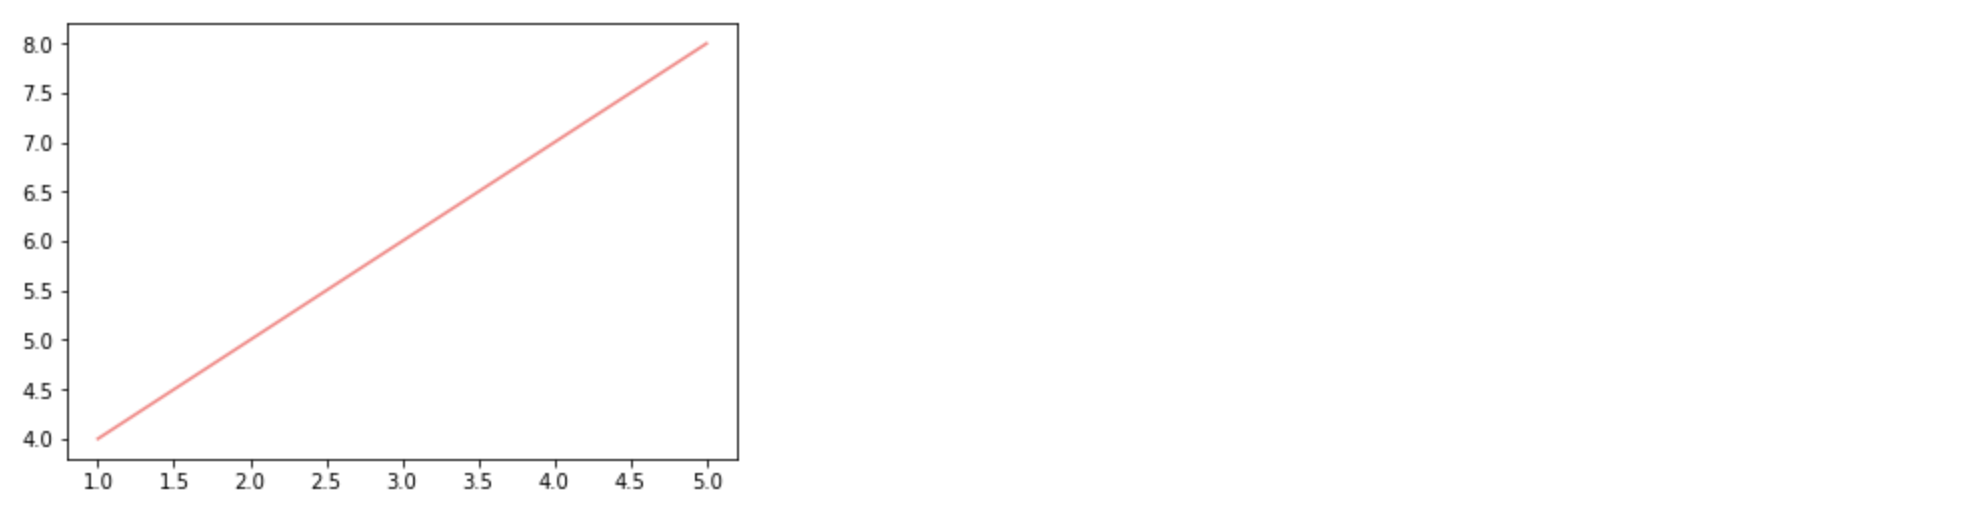
柱状图:plt.bar()
- 参数:第一个参数是索引。第二个参数是数据值。第三个参数是条形的宽度
plt.bar(x,y) 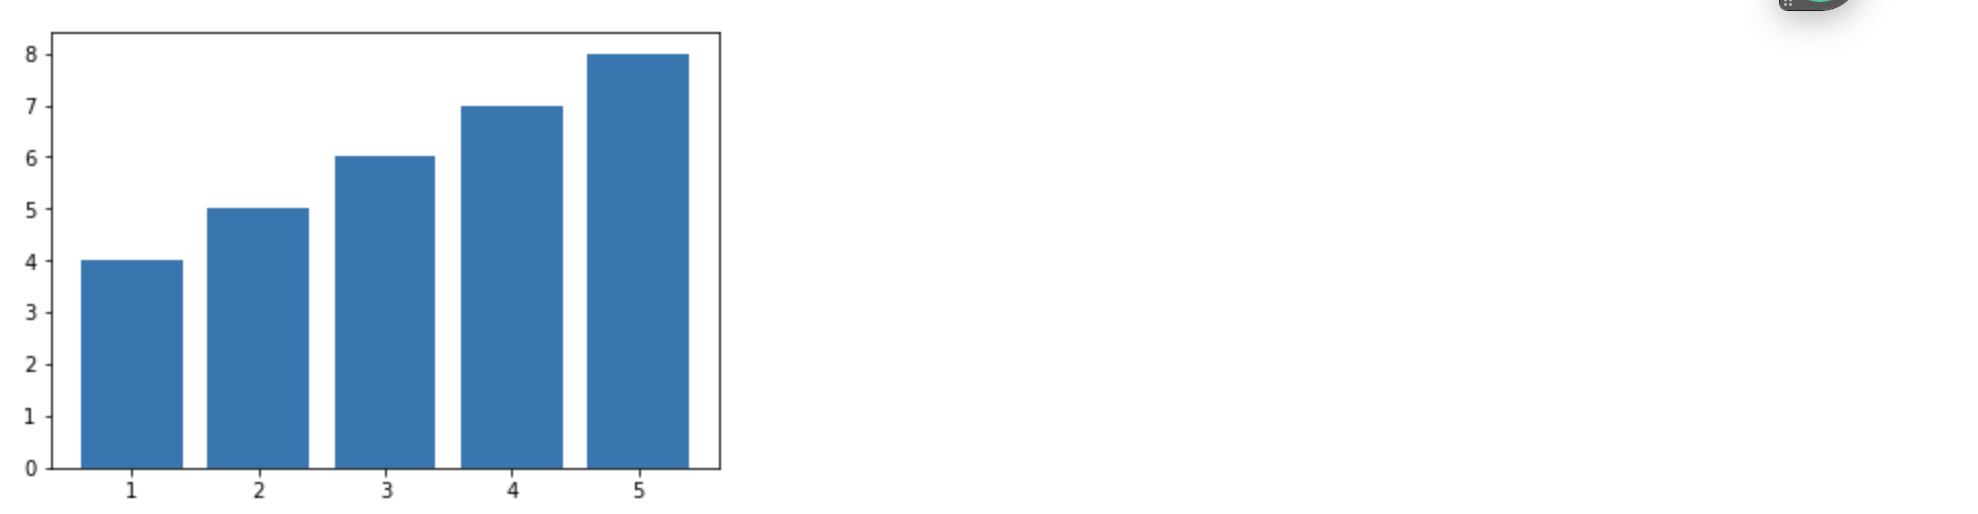
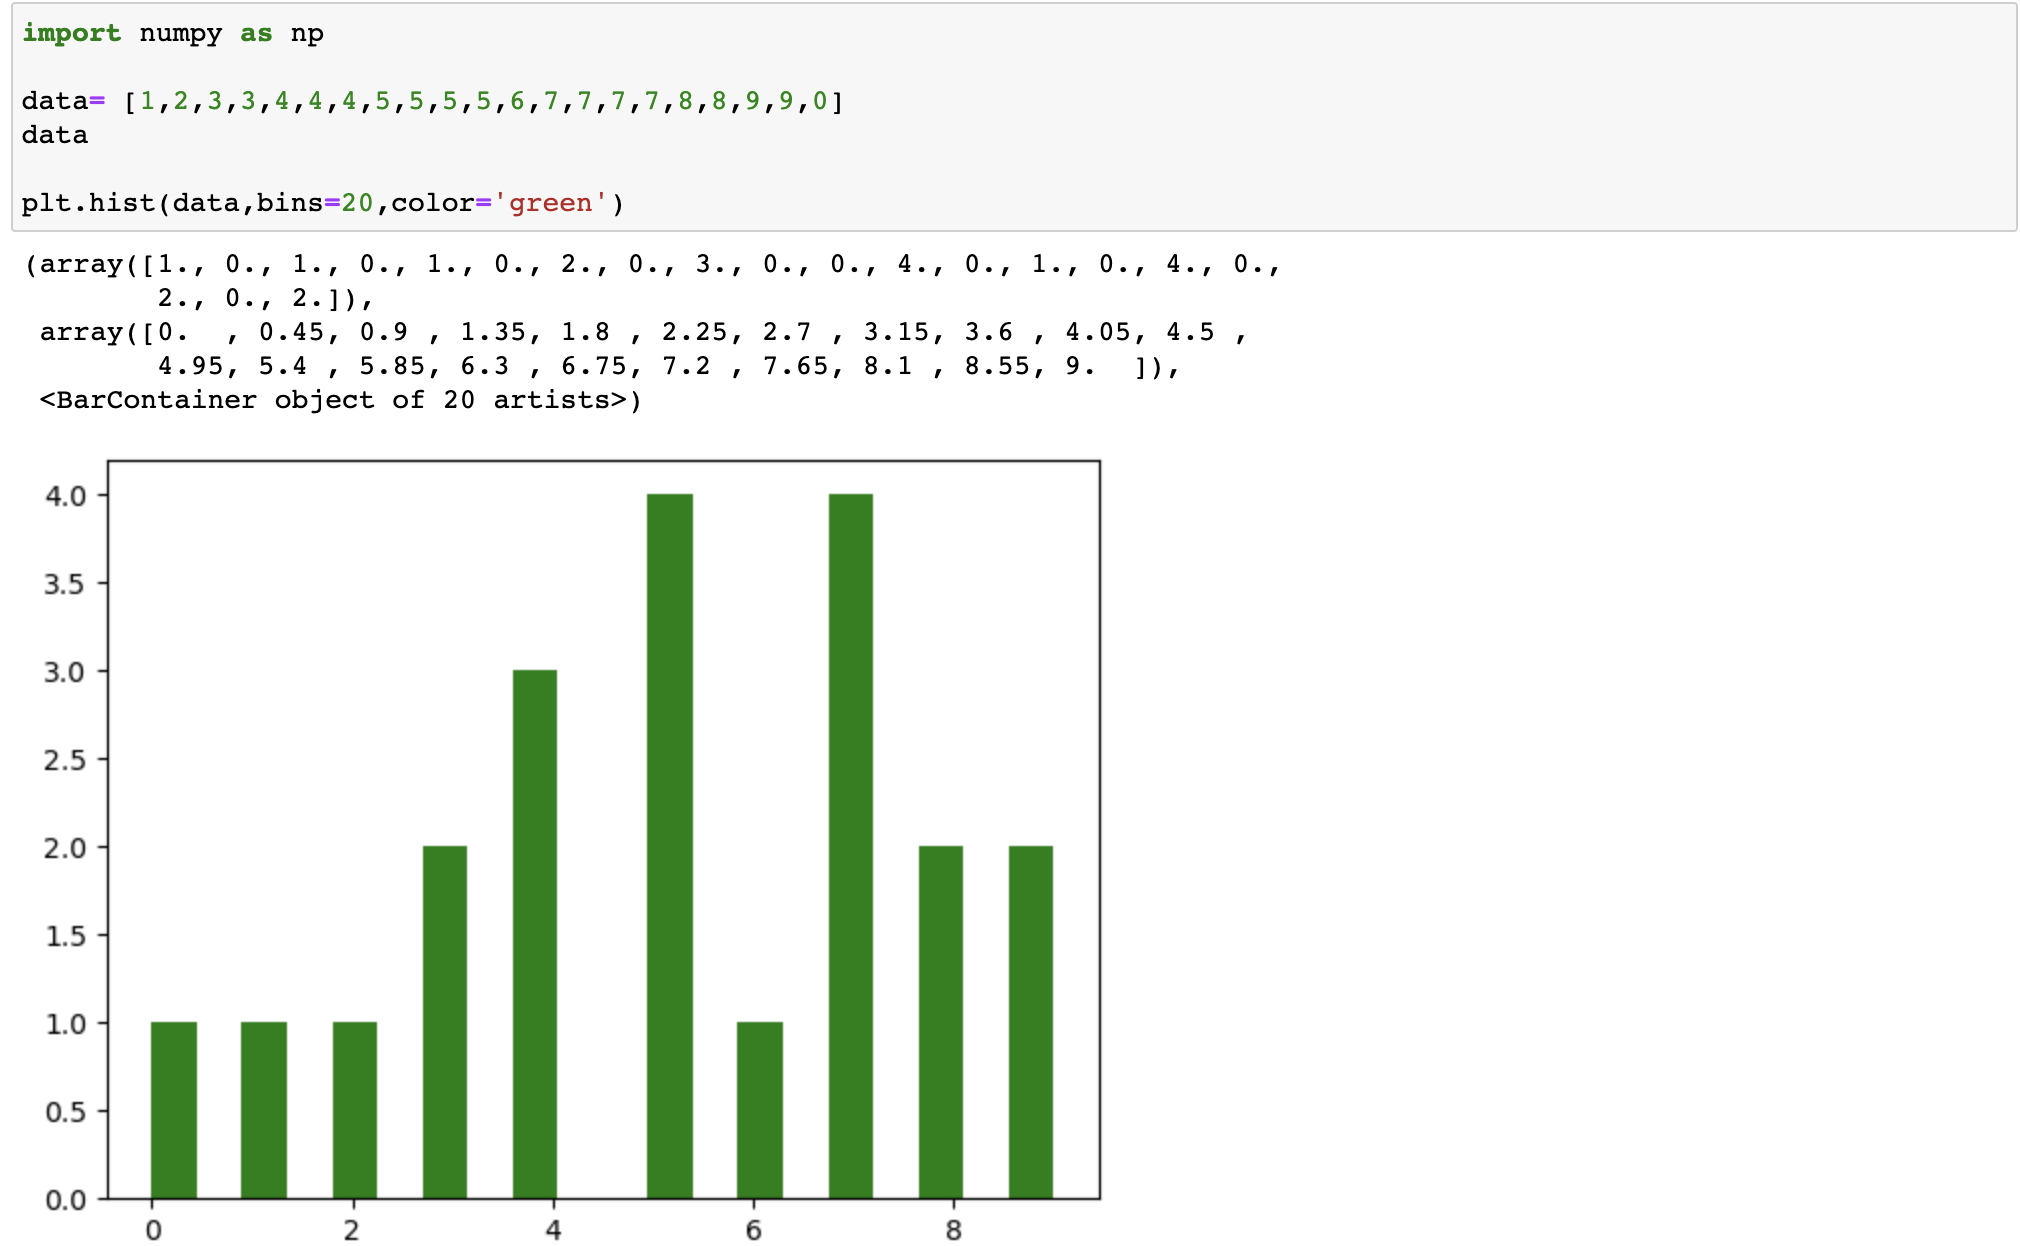
直方图
- 是一个特殊的柱状图,又叫做密度图
- plt.hist()的参数
- bins
可以是一个bin数量的整数值,也可以是表示bin的一个序列。默认值为10 - normed
如果值为True,直方图的值将进行归一化处理,形成概率密度,默认值为False - color
指定直方图的颜色。可以是单一颜色值或颜色的序列。如果指定了多个数据集合,例如DataFrame对象,颜色序列将会设置为相同的顺序。如果未指定,将会使用一个默认的线条颜色 - orientation
通过设置orientation为horizontal创建水平直方图。默认值为vertical
- bins
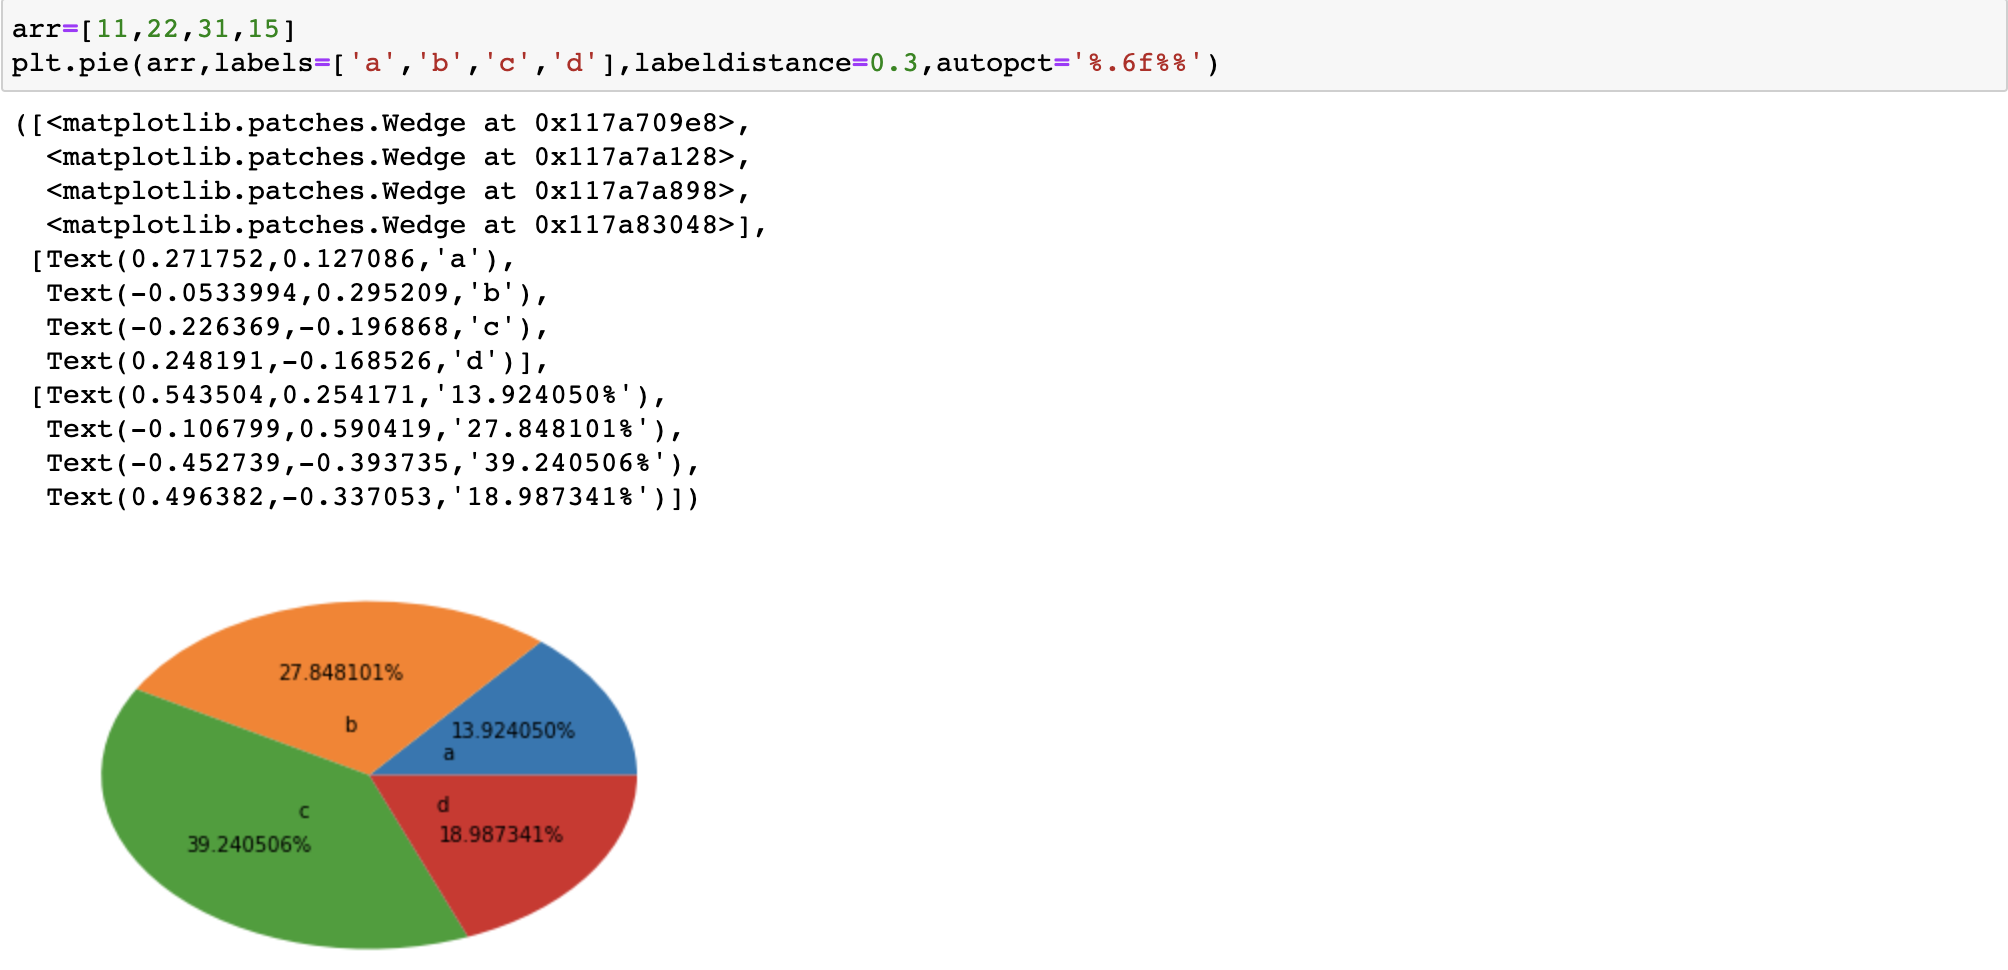
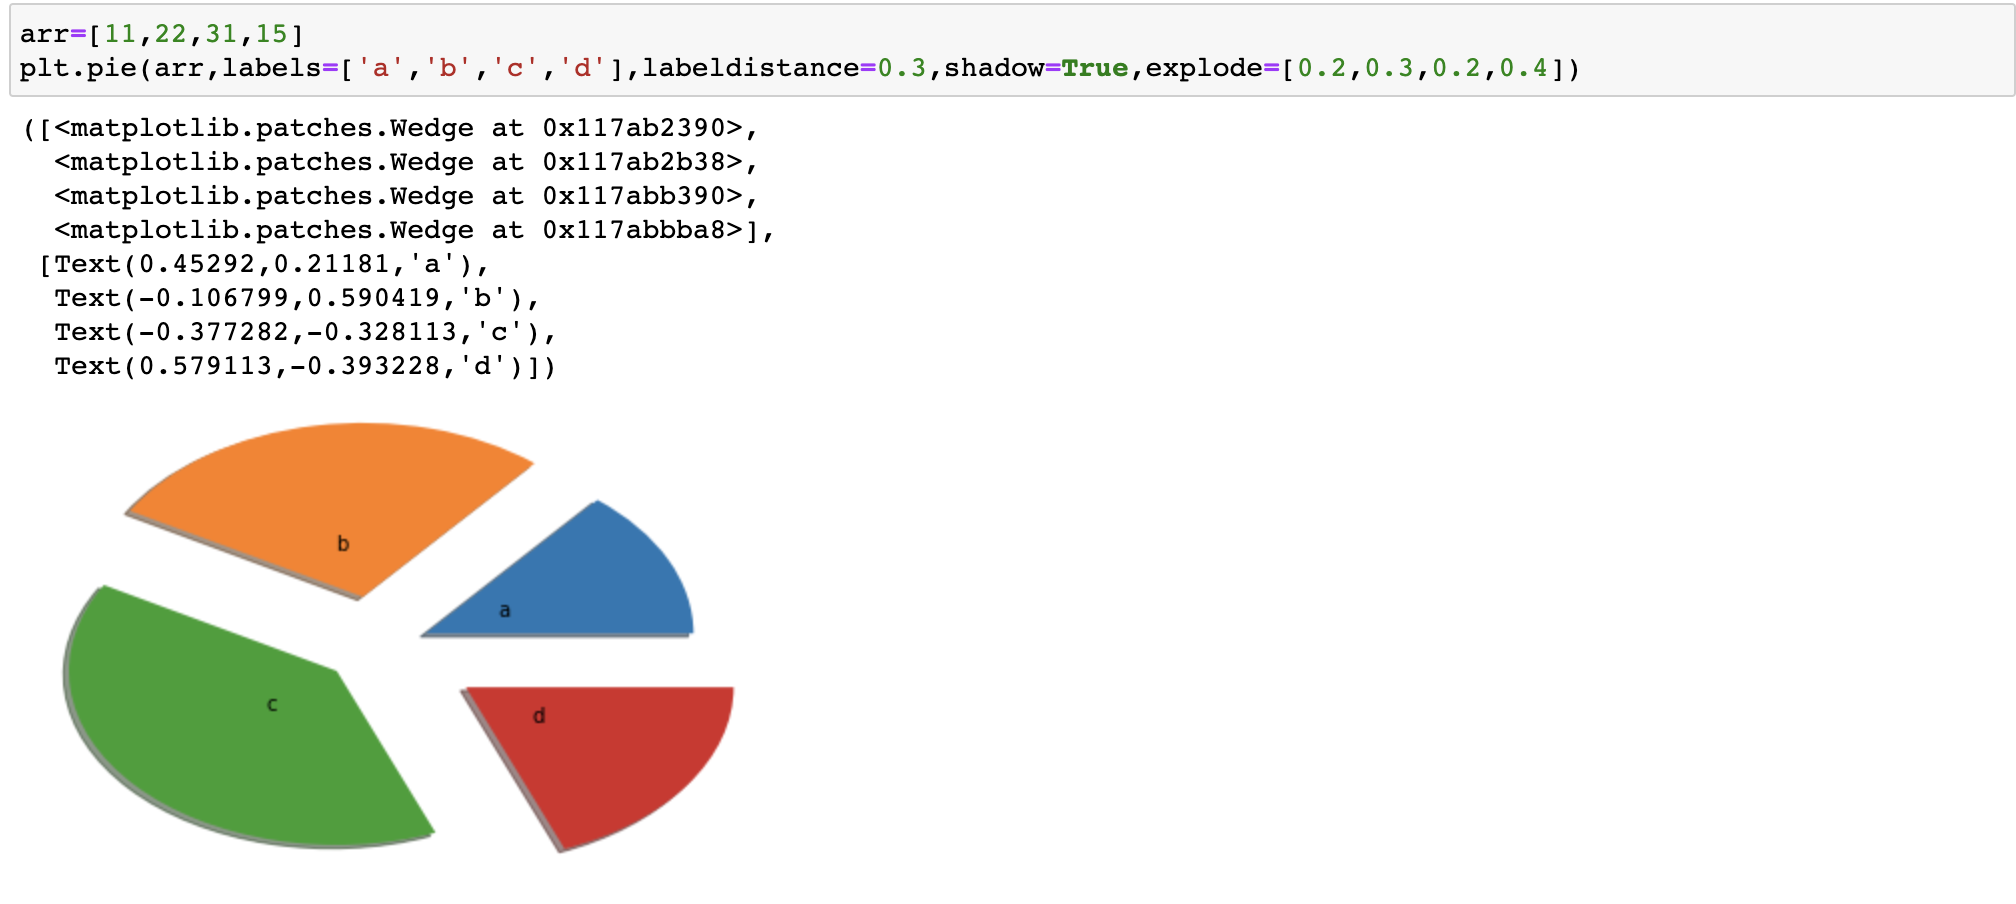
饼图
- pie(),饼图也只有一个参数x
- 饼图适合展示各部分占总体的比例,条形图适合比较各部分的大小
 arr=[11,22,31,15]

plt.pie(arr) 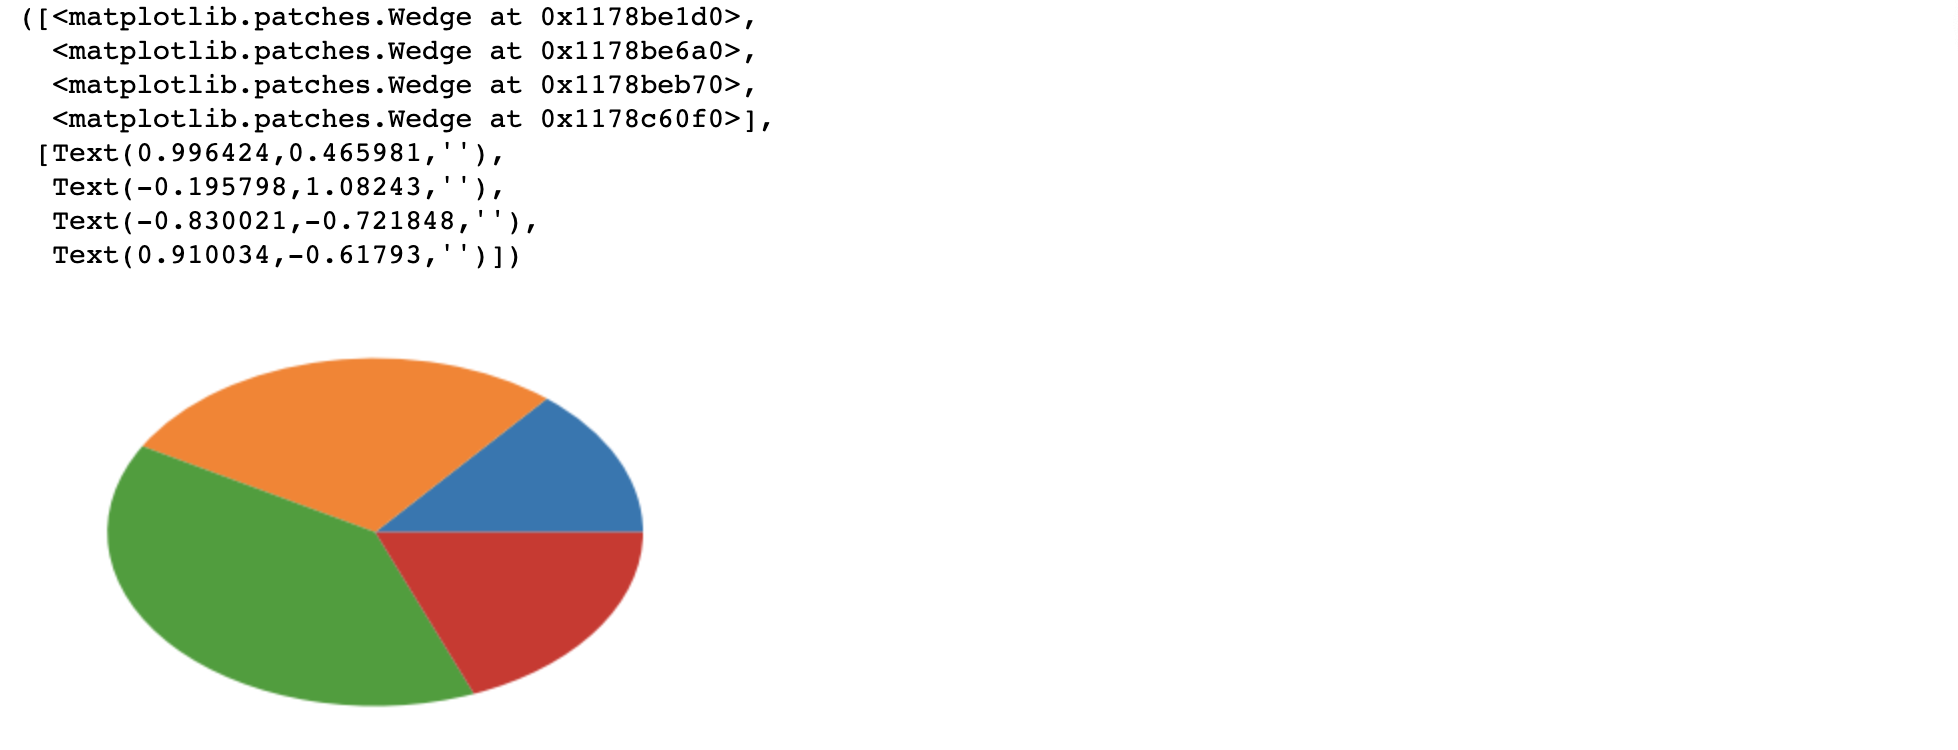
-
Labels:
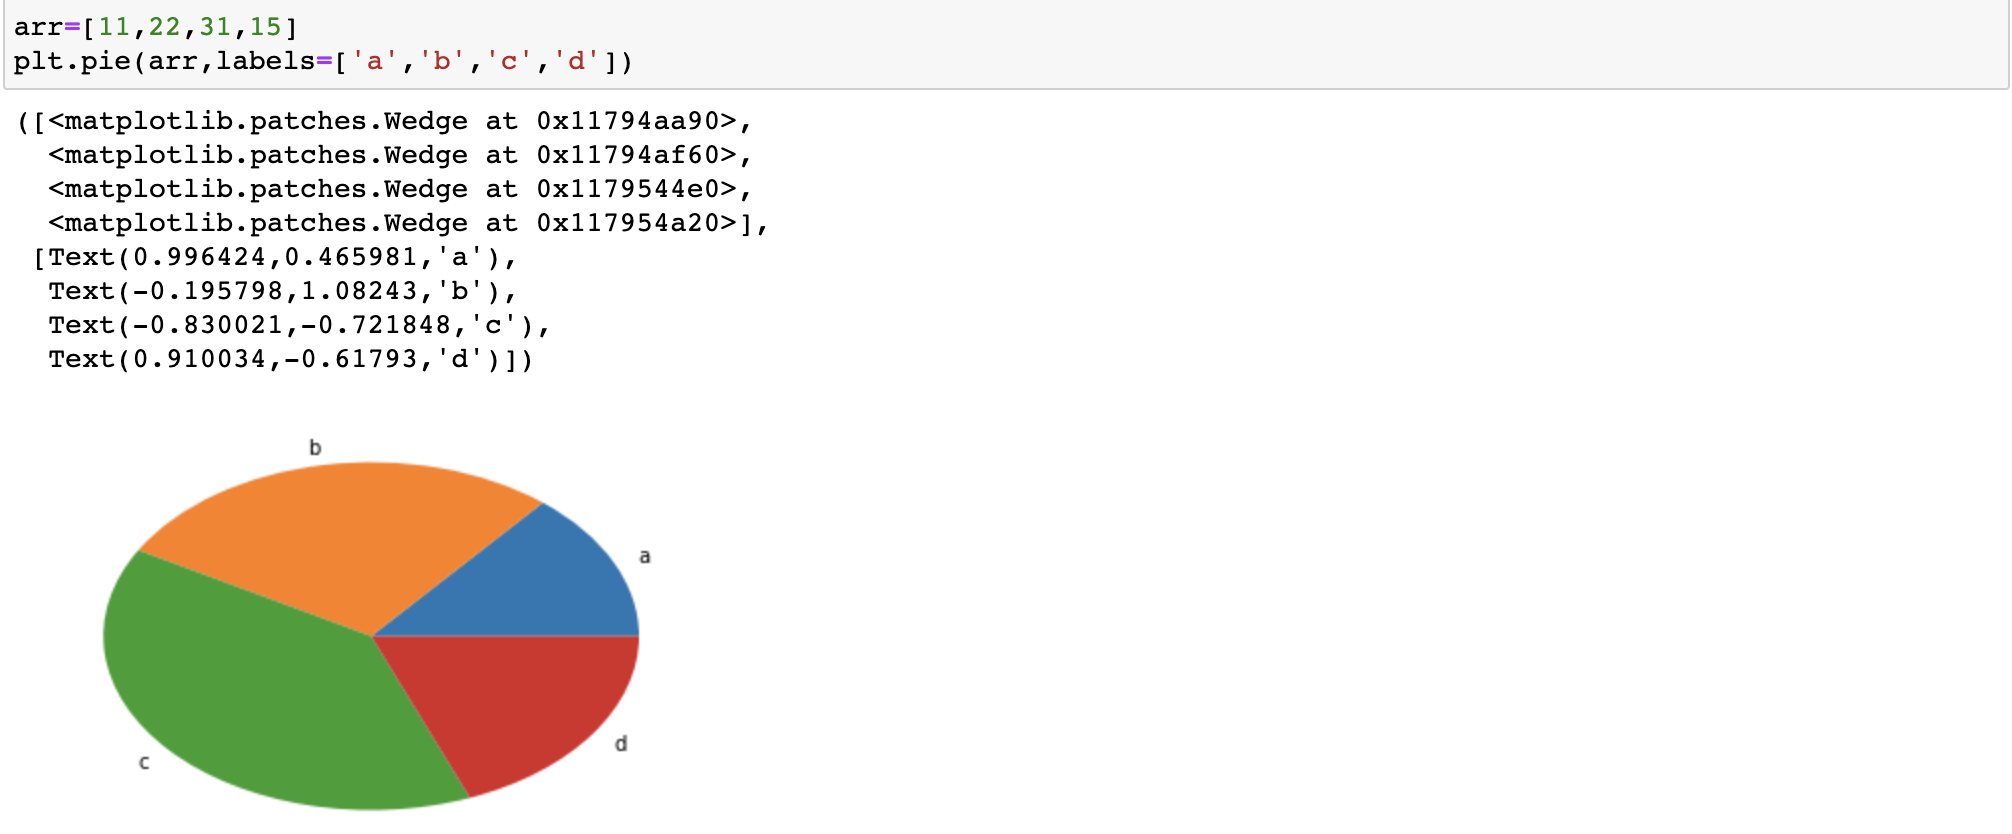
-
labeldistance
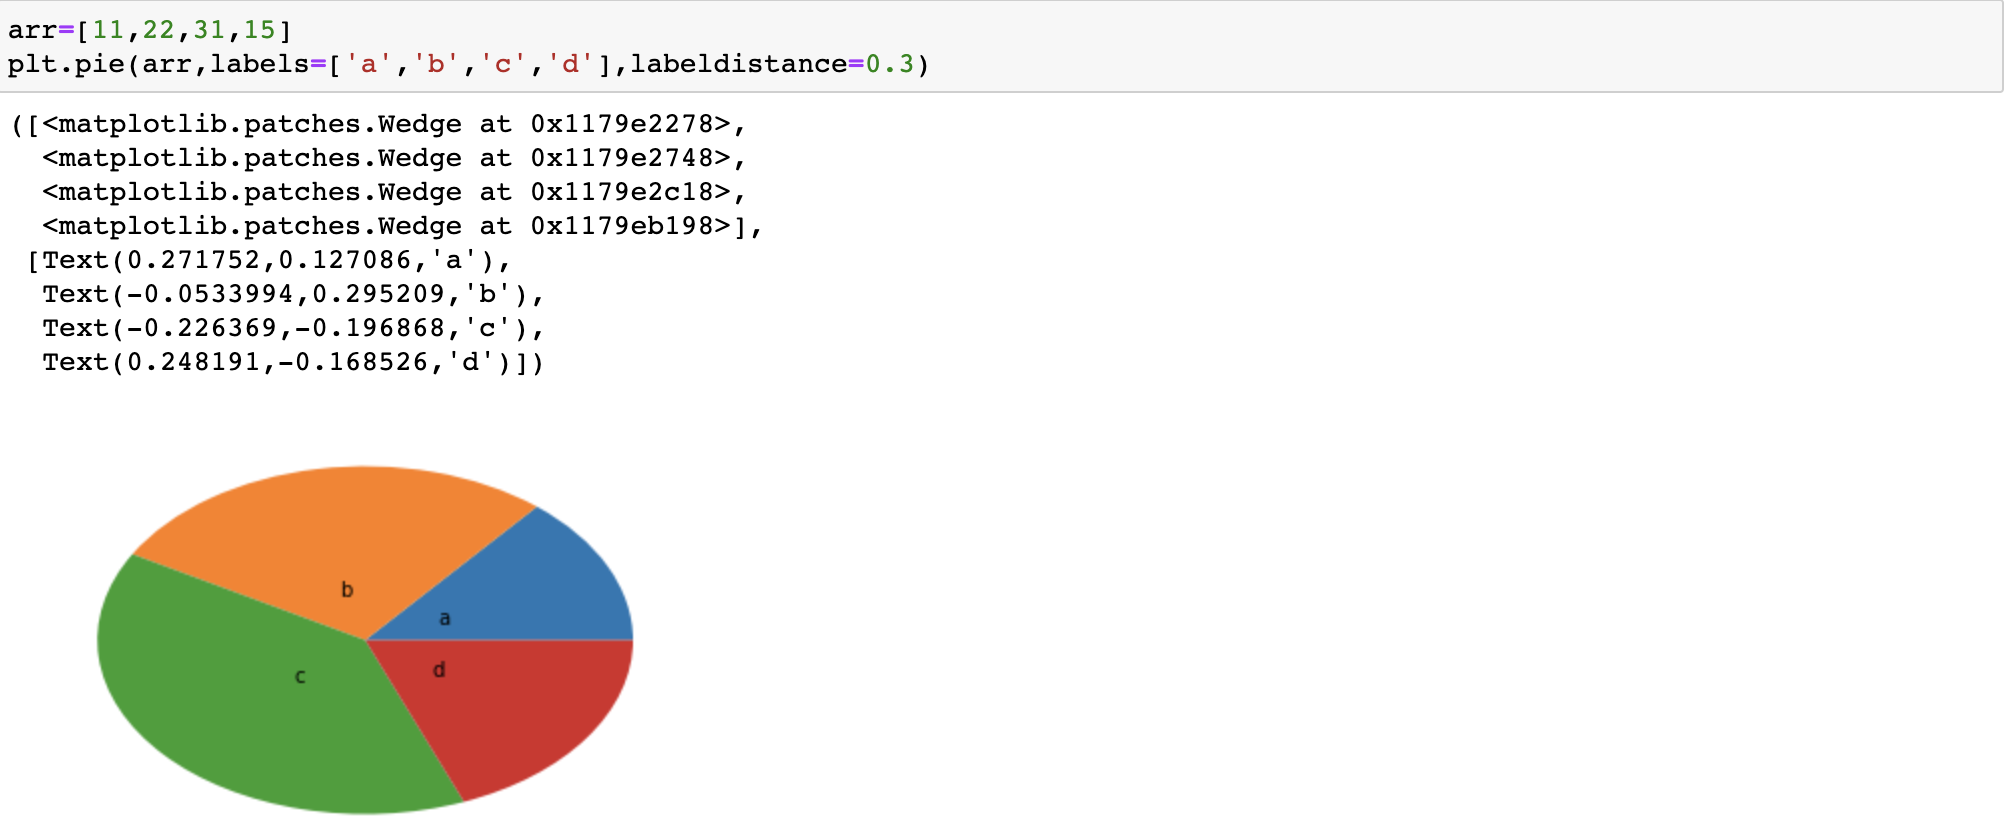
-
autopct
-
explode 到圆心的距离
散点图scatter()
- 因变量随自变量而变化的大致趋势
 x = np.array([1,3,5,7,9])

y = x ** 2 - 3

plt.scatter(x,y) 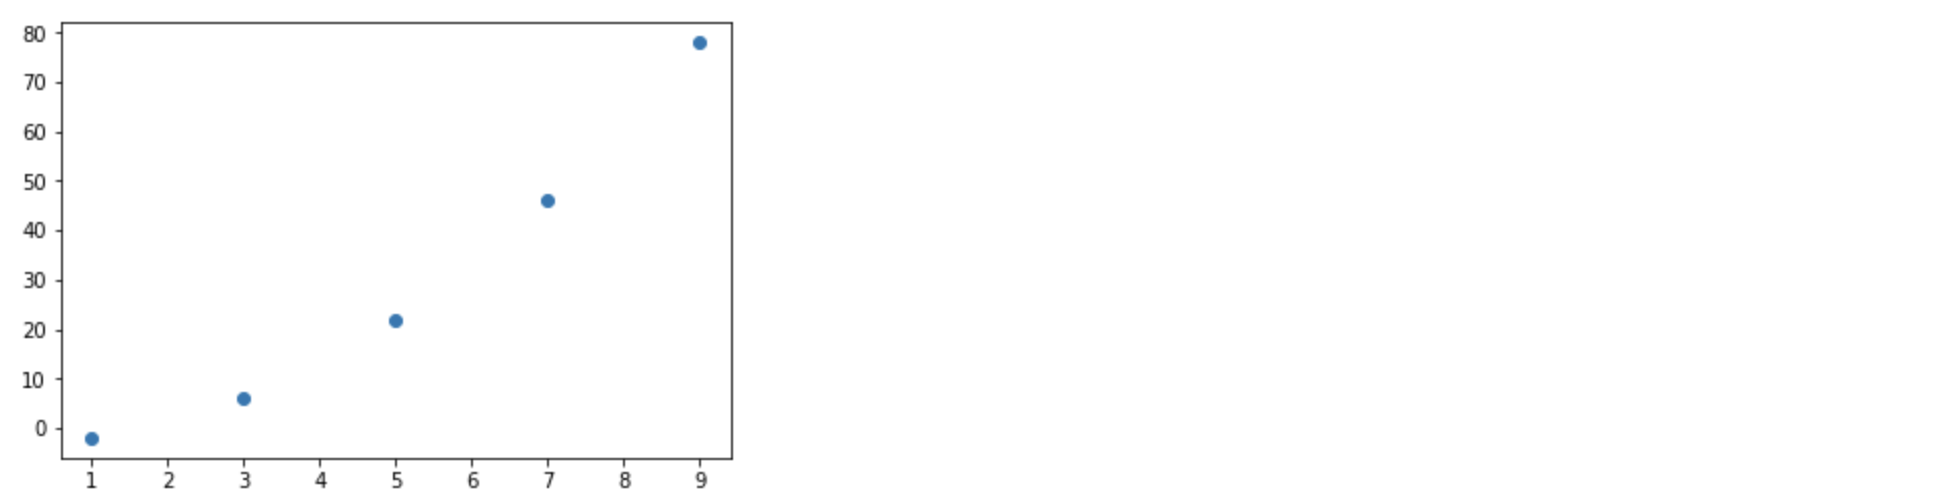
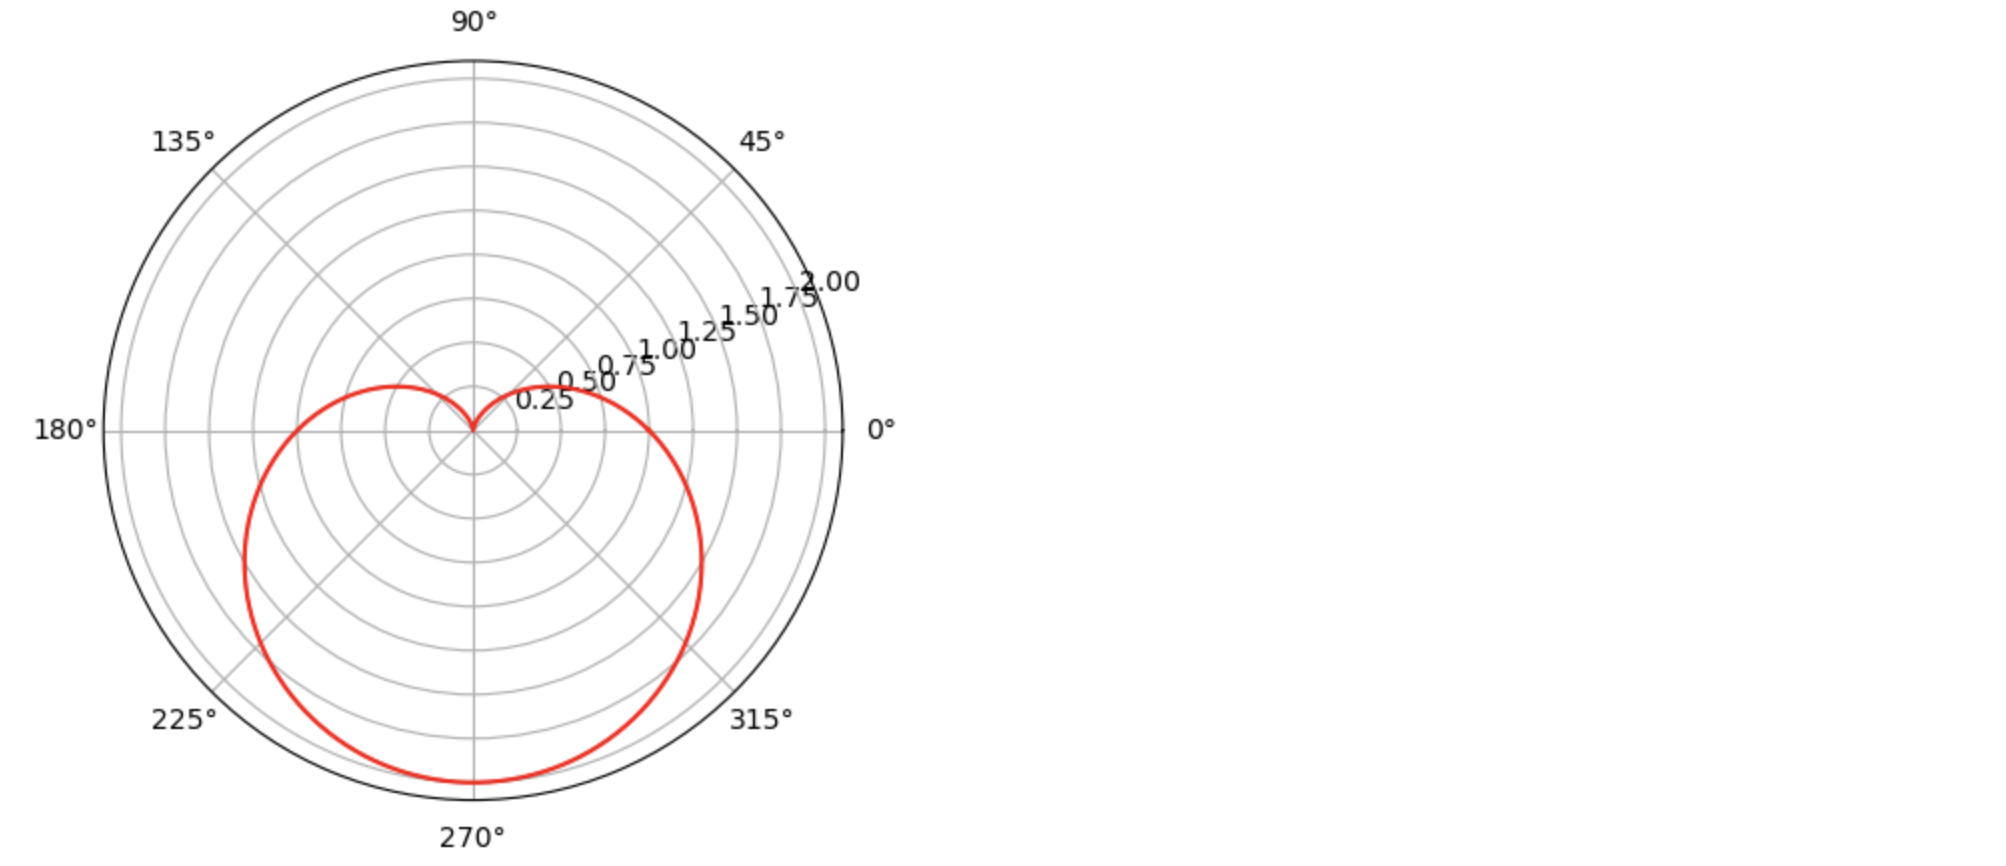
画爱心
 import numpy as np

import matplotlib.pyplot as plt

T = np.linspace(0, 2 * np.pi, 1024)  # 角度范围 0-2*pi,划为1024等份

plt.axes(polar=True)    # 开启极坐标模式

plt.plot(T, 1. - np.sin(T), color="r")

plt.show()